
Data analysis is an essential skill for anyone working with data. A skill that becomes increasingly complex the more disparate and disconnected sets of data you have. How do you communicate vital information in a relatable way to encourage action from your audience? This is the purpose of data storytelling.
Once you know how to tell a story with data, you can influence your listeners and drive change. So, just how do you do exactly that? What are some of the fundamentals of data storytelling?
What Does Data Storytelling Mean?
Data storytelling is the ability to build a narrative around complex data. It provides deep insights into data through simplified visuals to engage with your audience and bolster decision-making. The benefits of data storytelling include:
- Highlighting the critical points out of all your data
- Discovering valuable insights from your data
- Building trust and influence in your audience
- Adding a human touch to complex data.
Why Data Storytelling Works
Storytelling is as old as humanity, but data is a more recent occurrence in our everyday experiences. Our brains prefer stories over raw data because of how we function: we encounter a ton of information from our senses that we need to process what to keep or discard.
Raw data in a spreadsheet can be beneficial but problematic for us to assimilate. Data storytelling transforms it into a more palatable format. Data storytelling engages our language, emotional, and empathy sensors to identify the data as worth knowing and keeping in long-term memory.
Components of Data Storytelling
The three main components of data storytelling are:
The Data
Compile and analyze all your data to see the complete picture. Use various data analysis techniques like descriptive, predictive, or diagnostic analysis to build a foundation for your story.
Visuals
Use charts, graphs, photos, videos, illustrations, animations, and infographics to present an engaging and memorable data story.
Narrative
A narrative is a storyline that builds the context around your data and explains your insights. Your description also includes the actions you wish to inspire in your audience or problem-solving recommendations from the data.
Consider the four narrative elements as you plan how to tell a story with data:
Characters
These are all the parties involved in the data gathering and analysis process, from internal teams to customers and stakeholders. Define your characters clearly to understand their role in the data story.
Scenes
These are the settings or contexts in which your data story happens. A data story scene could be a company’s competitive market position in the industry or a policy change affecting business functions.
Conflicts
These are the data points that require attention, action, or change from your audience. For example, a data story conflict could be a drop in sales due to Covid-19.
Resolutions
These are the steps needed to address the conflict and restore the storyline to a flattering ending. Resolutions could involve developing a marketing campaign or offering discounts to retain customers.
Data Storytelling Examples
There are numerous storytelling with data examples because businesses function in various contexts. For this article, let’s use one example to demonstrate how to do data storytelling.
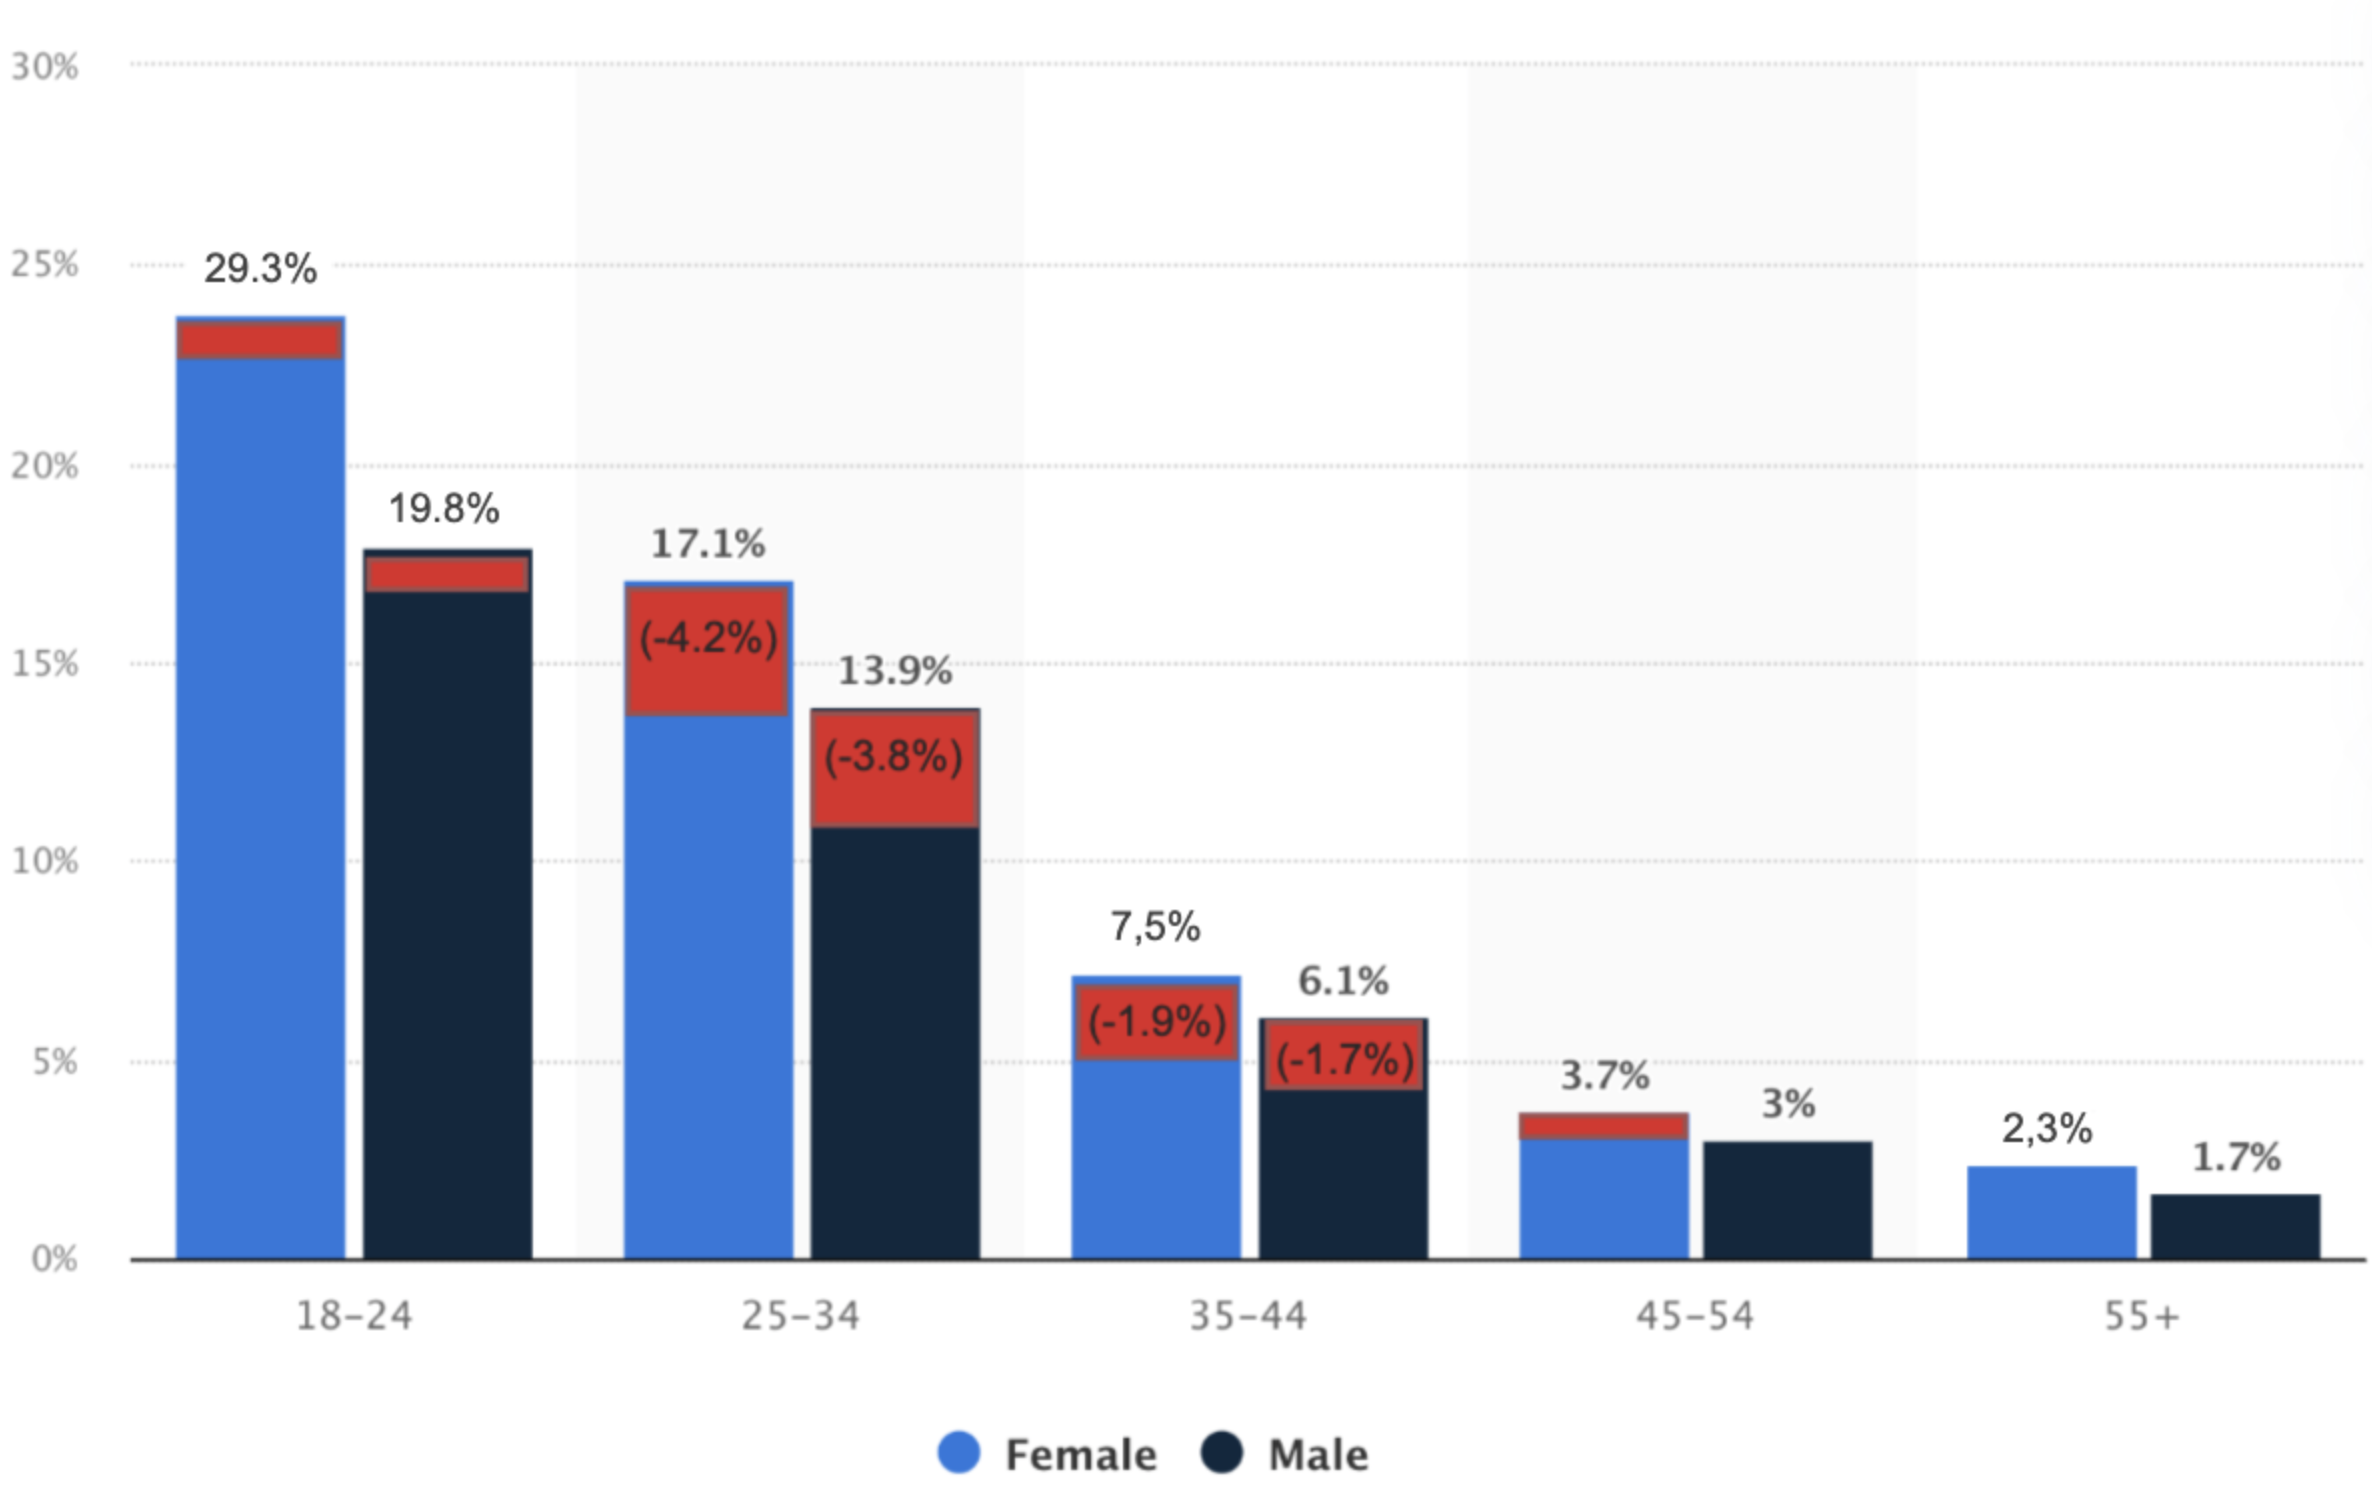
Say that a customer made a social media post about your company’s poor service, and the post went viral. This led to a drop in your sales and a negative brand image. Your data around this event reveals that the most affected customer demographic is millennials. Let’s see how to do data storytelling with this challenge in mind.
Graphs representation of the company’s sales before and after the post:
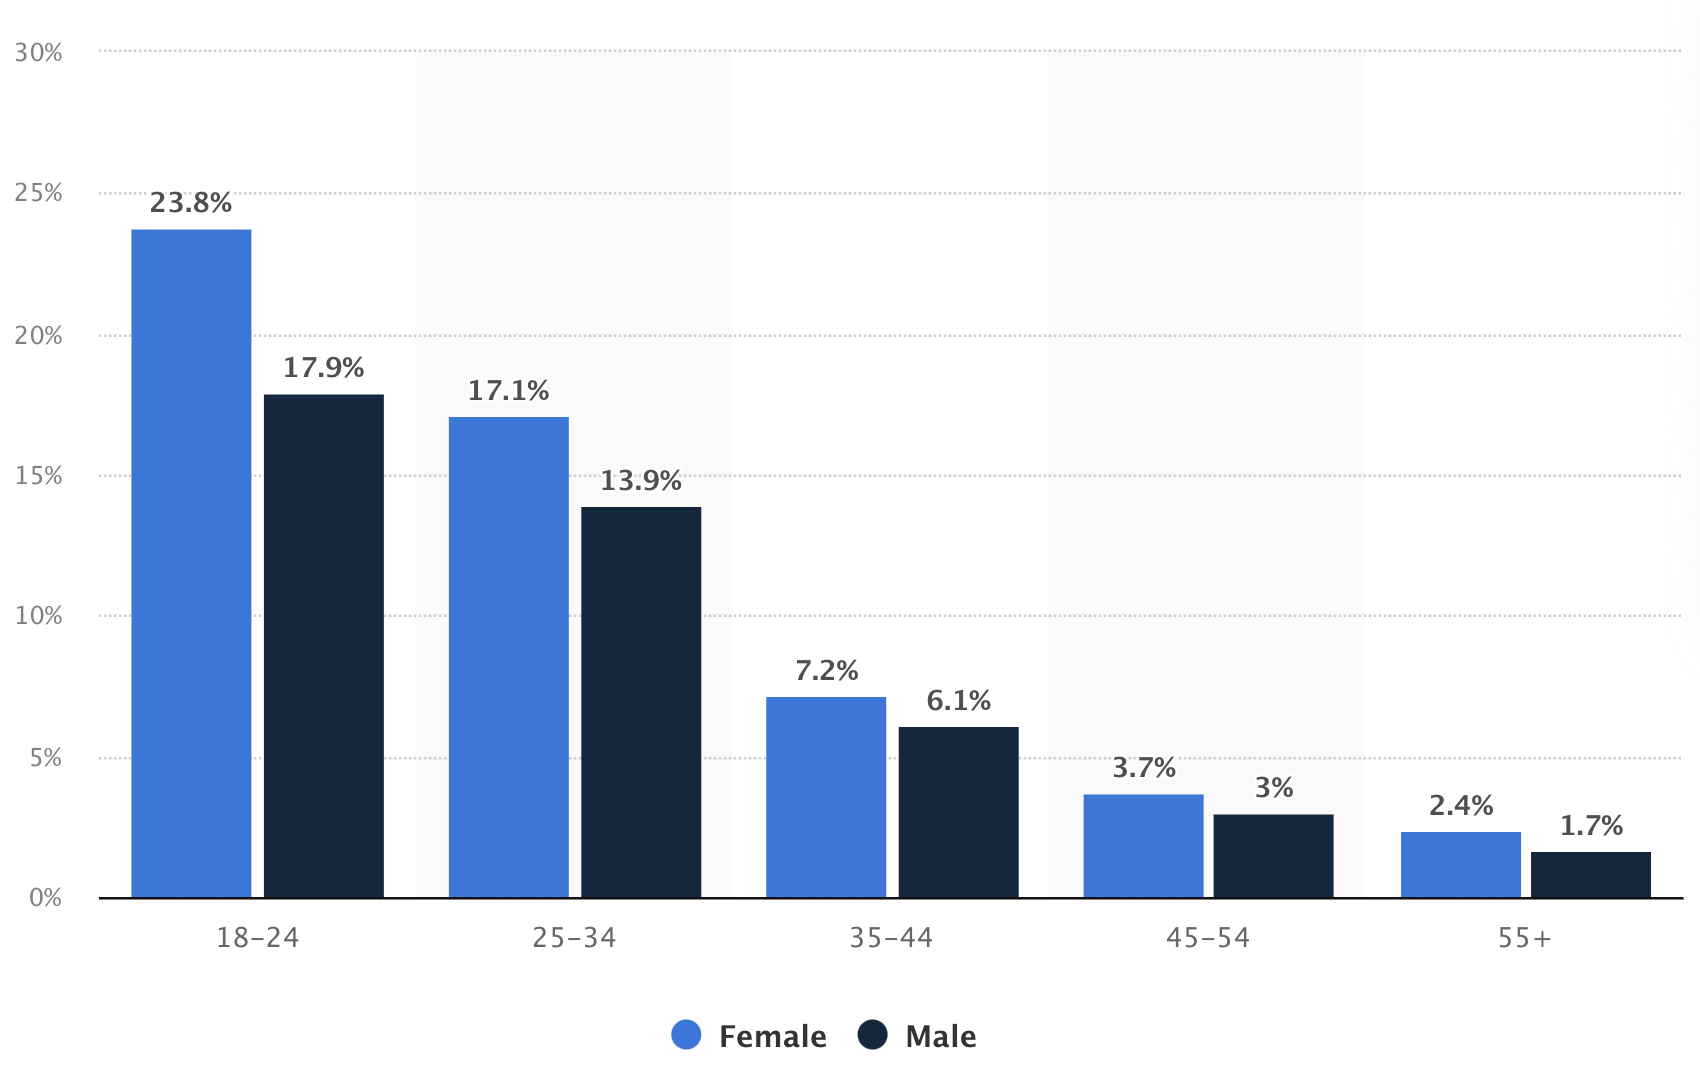
Your Characters
The aggrieved customer, the service attendant, the social media team, the sales, and marketing team, the accounting team, and so on. Note that you don’t have to feature all of these as individual characters in your data story, but keep them in mind as you analyze your data.
Your Scenes
The premises where the incident happened, the overall workplace culture, the industry conditions, the competitors, and much more. These are the backdrops for your data storytelling.
Conflicts
The social media backlash, the financial impact on your bottom line, the course of action taken to address the disgruntled customer, other internal factors, and the like.
Resolutions
A social media marketing campaign to restore brand image, customer service training for employees, a robust sales strategy to compensate for the losses, to give some examples.
With all these data points in mind, you can craft a story with a strong narrative and visuals to communicate with your audience effectively. For example, use a flowchart to demonstrate the course of events from the customer service incident to growing the bottom line.
You can also use a predictive model to show how best to engage with your customers in different scenarios to avoid adverse outcomes in the future. The possibilities are endless, but tell a story firmly anchored in your data analysis.
How To Tell A Story With Data: Expert Tips And Guidelines
If you can already visualize your data story at this point, you’re off to a great start. Here are some essential tips to help you to perfect your data story.
1. Bring Data to Life
Choose the right words and colors to breathe life into your data. Go for the most straightforward design choices with sparing colors, and highlight key insights to wow your audience.
2. Use of Graphs
Graphs are the most familiar data visualizations your audience will recognize immediately. Represent your crucial data points in graphs to help your audience quickly understand and take action.
That said, don’t try to cram all your data into one graph. Break up your data into separate graphs with accompanying text to tell a visual story. For the best results, answer one question or explain one point per graph.
3. Make Goals Visible
The brain processes 90% of input as visuals. A graphic representation of your business goals and targets makes them more actionable and achievable. Consider using dashboards or infographics to demonstrate your business goals.
When used effectively, these visualizations can:
- Show patterns or trends in your data from multiple viewpoints
- Streamline your data to help the audience process the information
- Offer the context and accurate insights from each data point
- Boost audience engagement and retention
4. Arrange Data Intuitively and Emphasize Thoughtfully
Good data storytelling reduces the effort for your audience to interpret your data. To begin with, ask yourself why you’re storytelling with data, then choose which data to explore.
Make thoughtful, intentional decisions about which context to use, which data points to highlight, and which to emphasize. Decide the matters you want to drive home to your audience, then arrange the data accordingly.
5. Create A Valuable Data Story
It’s tempting to want to cherry-pick the data that portrays you in a positive light, but remember that value comes from objectivity. Look at the complete picture and communicate the most valuable, unbiased data.
Use any unfavorable or underwhelming data to take your audience on a data storytelling journey through highs, lows, and resolutions. You can’t craft a great story if you have no conflicts in your data. Instead, use your data to encourage your audience to stay on the current course towards success.
6. Know Your Audience
The best way to influence your audience through data storytelling is to link your data to an emotional context. You can achieve this by understanding your audience. Know their goals, motivations, challenges, and opportunities to tailor your data storytelling. Use your data to create a purpose for them that resonates with their needs and connects them to the overall company goals.
Best Tools for Data Storytelling
There are plenty of data storytelling tools depending on your desired outcomes. You may want a stand-alone data visualization tool that integrates your existing data or a more design-oriented tool to create bold graphics. Here are some data storytelling solutions to get you started:
Tableau is a leading business data analytics solution with various features to build your data storytelling visuals or export to PowerPoint. Tableau comes with the built-in Stories feature to help you make a solid interactive narrative from your data. A Tableau story is a visualization sequence that integrates your worksheets and dashboards. Your audience can interact with these story points to reveal new insights or run queries against your data to build upon your narrative.
PowerBI is a Microsoft solution for data analytics and business intelligence. It’s ideal for enterprise-level businesses that generate and process high volumes of complex data daily. PowerBI integrates with other Microsoft 365 software, making it easy to exchange data from your spreadsheets, emails, CRM, and other applications in your business ecosystem.
Suppose you want to create infographics and reports for your data storytelling project. In that case, Infogram offers templates to get your creativity going. Instead of starting your data story with a blank page, customize an Infogram template with your business logo and corporate colors to save time. Infogram also allows real-time collaboration and permissions to work on your data story together as a team.
Sisense is a three-in-one data storytelling solution that draws insights from HR, marketing, financial, and customer service data. It also integrates with other business apps like Slack, Teams, and Salesforce to show you how to do data storytelling. Sisense relies on AI and machine learning to make data analysis accessible to everyone. You don’t need any coding experience for Sisense data storytelling.
Start Your Data Storytelling Journey with Sphere Partners
Sphere Partners delivers world-class data analytics customized for your business needs. We can implement business intelligence platforms into your business, such as PowerBI and Tableau, or build a solution to match your specific requirements. We also leverage artificial intelligence and machine learning into data analysis to create insightful data storytelling.
We can also help you develop a comprehensive data strategy to inform your data storytelling process, whether you’re a small business or a multinational organization. Begin with aggregating all your data sources into a scalable data warehouse.
Our data engineers then optimize your data flows and extract highly accurate data to feed into your business data architecture. We support all your data storytelling projects using the most up-to-date data to inform and inspire your audiences. Learn more about how our data storytelling solutions can work for you. Contact us for a free consultation today.