
My name is Gevorg Zoroghlyan, and I am a Software Engineer with six years of experience in the industry. I specialize in web development, and have been working at Sphere Partners for the past year.
Throughout my career, I have gained a strong understanding of the software development life cycle, and have had the opportunity to work on various projects from start to finish. I am passionate about coding and creating high-quality, user-friendly applications that meet the needs of clients.
In this article, I will share my curated tips I’ve accumulated over the years on improving speed and overall performance of client-side applications. Having worked on numerous projects optimizing applications, I’d like to provide you with some insights into ways you too can ensure optimal performance of your business applications. So let’s get right into it.
Why is speed important to Increase Application Performance?
The answer is simple: fast applications provide a better user experience, increase engagement, improve search engine optimization, and lead to higher conversion rates. As the industry is already aware, slow applications are correlated with high bounce rates, lower overall engagement, and lower conversion rates.

According to a study by Google, a delay of just one second can result in a 7% reduction in conversions. A study by Kissmetrics found that 40% of people abandon a website that takes more than three seconds to load. Additionally, Google has stated that page speed is a factor in its search engine ranking algorithm. A study by Akamai found that 79% of customers who are dissatisfied with website performance are less likely to return and buy from that site again.
More Reasons To Increase Application Performance
Aside from an unsatisfactory user experience, slow webpages are far less likely to rank well in search engine results like Google. So, if your website pages are slow, they’re less likely to be discovered by your target audience in the first place.
Reduce Network Latency with a Content Delivery Network (CDN)
So how do we improve application performance?
Let’s start with network latency. Network latency refers to the time it takes for data to travel from the server to the client, and vice-versa. This can be affected by the distance between the client and server, network congestion, and the quality of the network connection.
To reduce network latency, we can utilize a content delivery network (CDN). A CDN stores cached versions of our website in multiple locations around the world which allow for faster access from anywhere in the world.
Use a content delivery network (CDN) to reduce the distance the data needs to travel, minimize network congestion, and optimize the quality of the network connection.
Popular CDN providers include Akamai, Cloudflare, Amazon CloudFront, Fastly, and Limelight Networks.
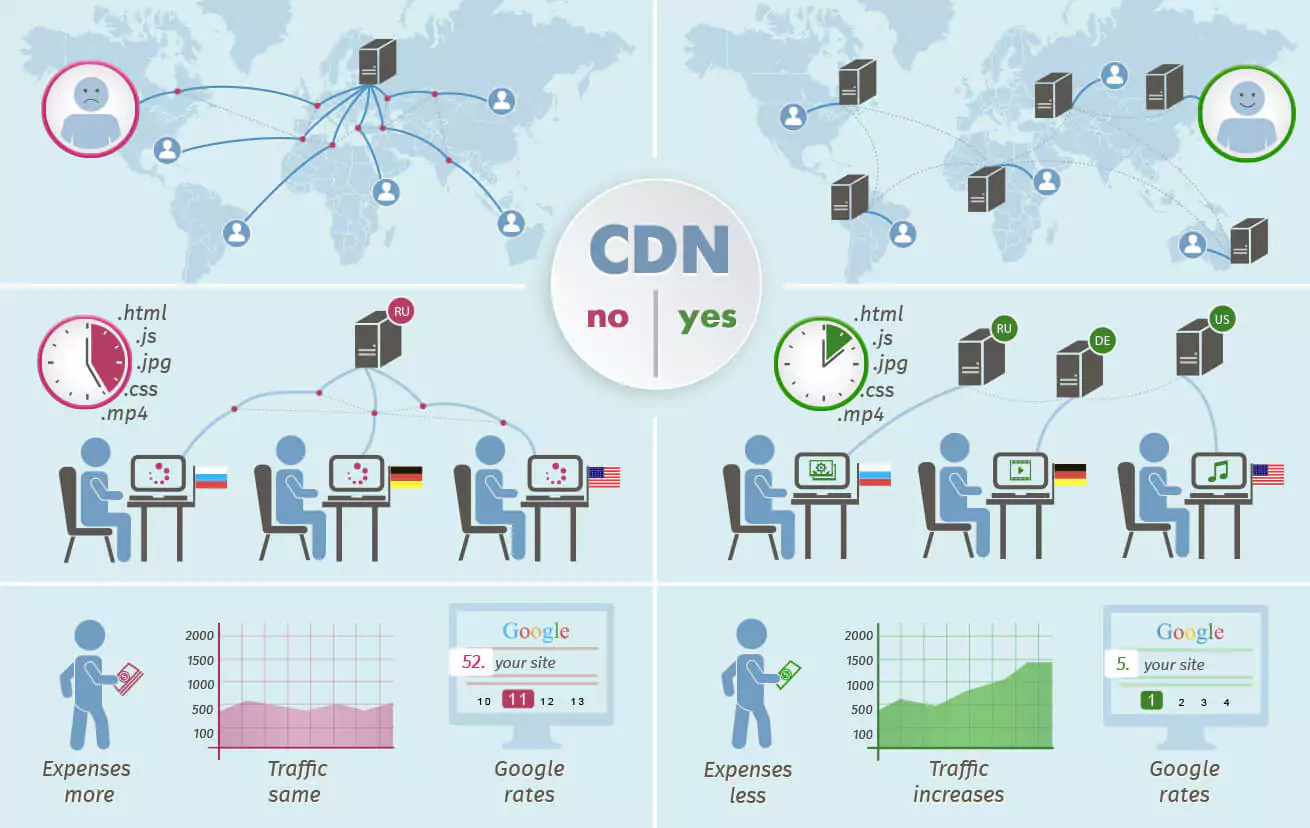
On the left side of the image above, we can see a website without a CDN. The website is hosted on a single server and users from all over the world are trying to access it. As a result, the website is slow to load and some users may experience delays or even timeouts. This leads to poor user experience and users may abandon the site before seeing the content they were looking for. Furthermore, the server is overwhelmed with traffic and this can lead to downtime which is costly for the business.
On the right side of the image above, the website has a CDN. The CDN has multiple servers spread across different geographical locations allowing the website to deliver content to the user from the server closer to them. This leads to improved overall satisfaction of the user from their experience with the website. The CDN also reduces the amount of traffic the website server has to handle which means that server can operate more efficiently, with greater reliability.
Why Distributing The Load Improves Application Performance
Finally, by distributing the load across multiple servers, the business can avoid costly downtime which can have a significant impact on revenue and brand reputation. In summary, by using a CDN, businesses can improve their user satisfaction, increase their website traffic and reduce costs.
JavaScript Parsing and Execution Time
Another important factor in application performance is JavaScript (JS) parsing and executive time. By default, JavaScript executes on the main-thread and when this is happening, the browser cannot execute other tasks.
Depending on the order in which the scripts are executed, this could prevent elements from being painted, delaying page rendering and affecting page interactivity. Reducing JavaScript execution time essentially reduces the main-thread blocking time – in turn, potentially weakening the effect of cascaded requests.
We can make use of code-splitting techniques. Code splitting involves breaking up our JS code into smaller chunks and only loading the code that is needed for a particular page or feature. It’s a feature supported by bundlers like Webpack, Rollup and Browserify (via factor-bundle) which can create multiple bundles that can be dynamically loaded at runtime.

In the image above, we can see a few scenarios related to code splitting. In the first scenario, there is no code splitting involved. Here, when the browser requests the front page, the server returns not only the required front page but also all else related to all pages, all forms, etc. As a result, the browser ends up loading unnecessary data, causing slow page load and poor user experience.
Now, let’s move on to the second scenario where code splitting is used. When the browser requests the front page, the server only returns the front page and not anything else. This technique of code splitting increases page load times, reduces server load and enhances overall user experience.
Remove Unused Code To Improve Application Performance
The next approach is to remove unused code. This can be due to outdated features, code refactoring, and changes in requirements. Leaving unused code can have a negative impact on your overall website performance.
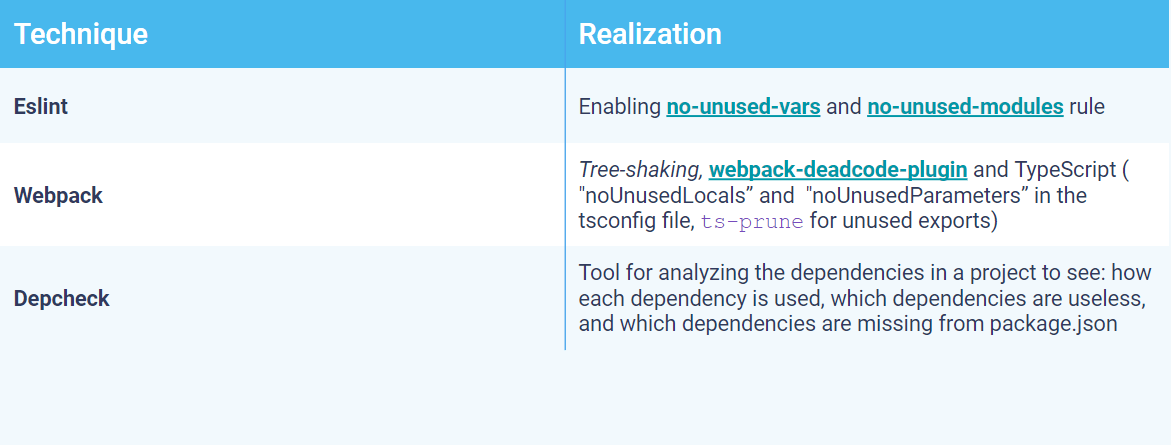
Unused code can increase the overall size of your application which can lead to slower page load times and increased memory usage. This can in turn cause performance issues and lead to poor user experience. We can use tools such as Eslint, Webpack and Depcheck to remove unused code from our application. Rules, tools and plugins can be enabled as seen below to further improve application performance.
Caching Improves Application Performance
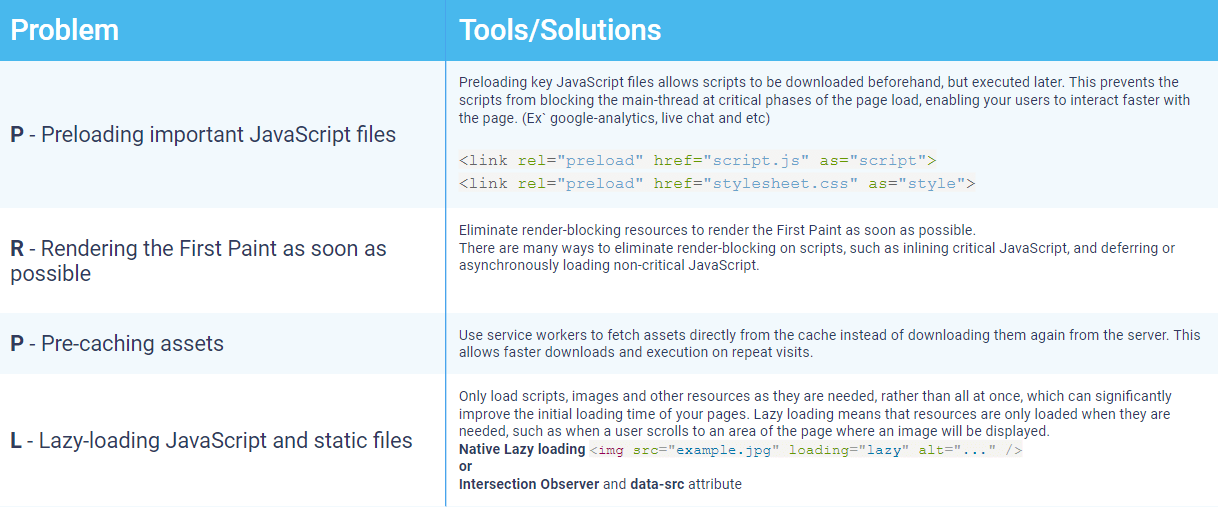
Caching is another important technique for improving application performance. The PRPL pattern is particularly useful for optimizing caching. PRPL stands for Preloading, Rendering, Pre-caching and Lazy-load. The pattern involves pushing critical resources to the client as early as possible, rendering the initial view of the page, pre-caching remaining resources, and lazily loading non-critical resources as needed.
When the website first loads, only some images load. Let’s take for example lazy-loading JavaScript and static files, only images that are visible in a user’s view are loading. The other images which are further down on the page are not loaded unless the user scrolls down to view them. This makes the website load faster as it doesn’t have to load all the images all at once. This also improves the user experience as the user can start viewing the content on the page more quickly. Furthermore, as the user scrolls down, the images are loaded only when they come to view. This means that the website doesn’t load images that can slow it down that a user might never see. This is particularly useful on mobile devices where bandwidth is often limited.
Here is also preloading important JavaScript files. This can be achieved by using preloading keys. It also allows scripts to be downloaded beforehand, but executed later. This prevents the scripts from blocking the main-thread at critical phases of the page load, enabling your users to interact faster with the page. Examples: google-analytics, live chat. It can be achieved using this preload code for scripts and style sheets:
<link rel="preload" href="script.js" as="script">
<link rel="preload" href="stylesheet.css" as="style">
Other approaches include Rendering the First Paint as soon as possible and Pre-caching assets as seen on the image below.
In addition to caching, here are some more helpful tips to improve application performance:
Compressing Images & Large Files
One should compress images and other large files as high resolution images take longer to download which results in slower page load. You can compress images using online services such as TinyPNG without losing the quality of the image.
Minimize HTTP requests
Its best practice to minimize HTTP requests where possible. Each HTTP request takes additional time to complete and the more HTTP requests your page makes, the slower it will load. You can reduce the number of requests by combining multiple files into a single file, and using image sprites to combine multiple images into a single file.
Use JSON instead of XML
JSON is an efficient text-based format. Its recommended to use text-based formats for resources whenever possible, e.g. JSON instead of XML. Text-based formats are generally smaller and faster to transfer over the network than binary formats like XML. Consider using text-based formats like JSON or YAML for data that needs to be transferred between your server and client.
Use WebP instead of JPEG and PNG to Increase Application Performance
Adopt the use of modern image formats, such as WebP, which result in smaller file sizes and faster loading times. Modern image formats, such as WebP, offer better compression and smaller file sizes than older formats like JPEG and PNG. By using modern image formats, you will reduce the file size of your images and improve their overall loading time.
Client-Side Performance Monitoring Tools
To monitor application performance, you can use performance monitoring tools, such as Google Lighthouse and GTmetrix. These tools analyze your website or application and provide recommendations for performance improvement. Let’s look at some of them in more detail.
Google Lighthouse
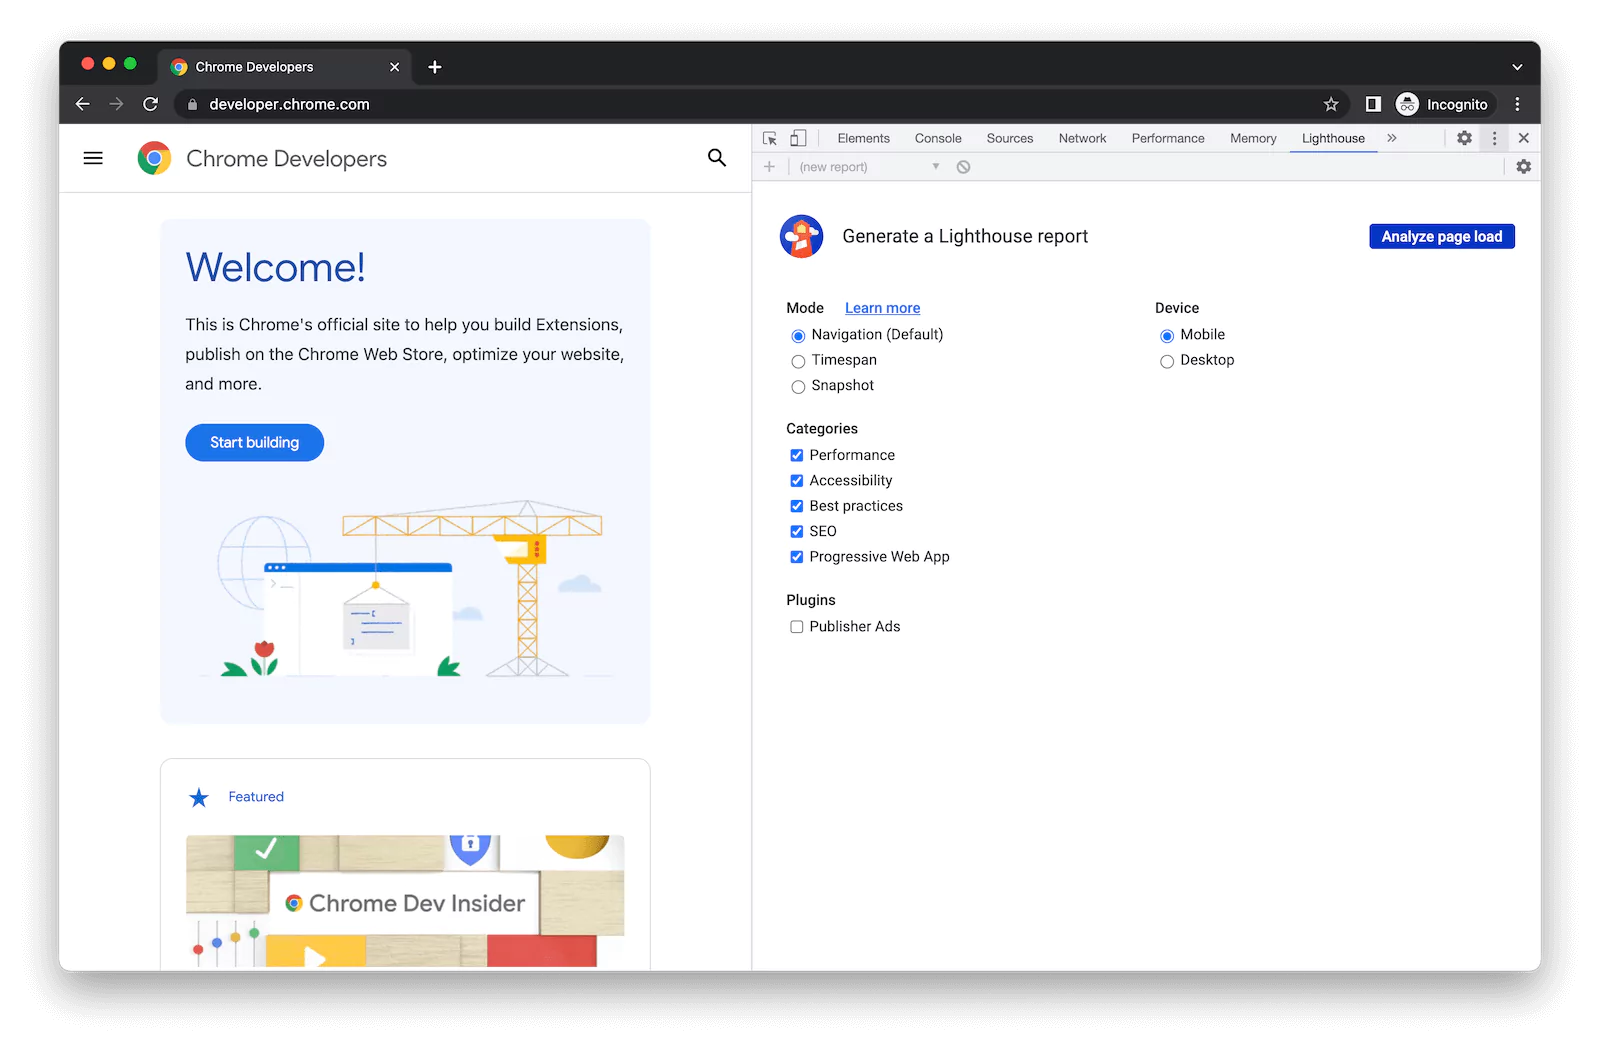
Lighthouse is an open-source, automated tool for improving the quality of web pages. You can run it against any web page, public or requiring authentication. It has audits for performance, accessibility, progressive web apps, SEO, and more. Here are the steps to run Google Lighthouse in Chrome DevTools:
- Download Google Chrome for Desktop.
- In Google Chrome, go to the URL you want to audit. You can audit any URL on the web.
- Open Chrome DevTools.
- Click the Lighthouse tab.
- Click Analyze page load. DevTools shows you a list of audit categories. Leave them all enabled.
- Click Run audit. After 10 to 60 seconds, Lighthouse gives you a report on the page.
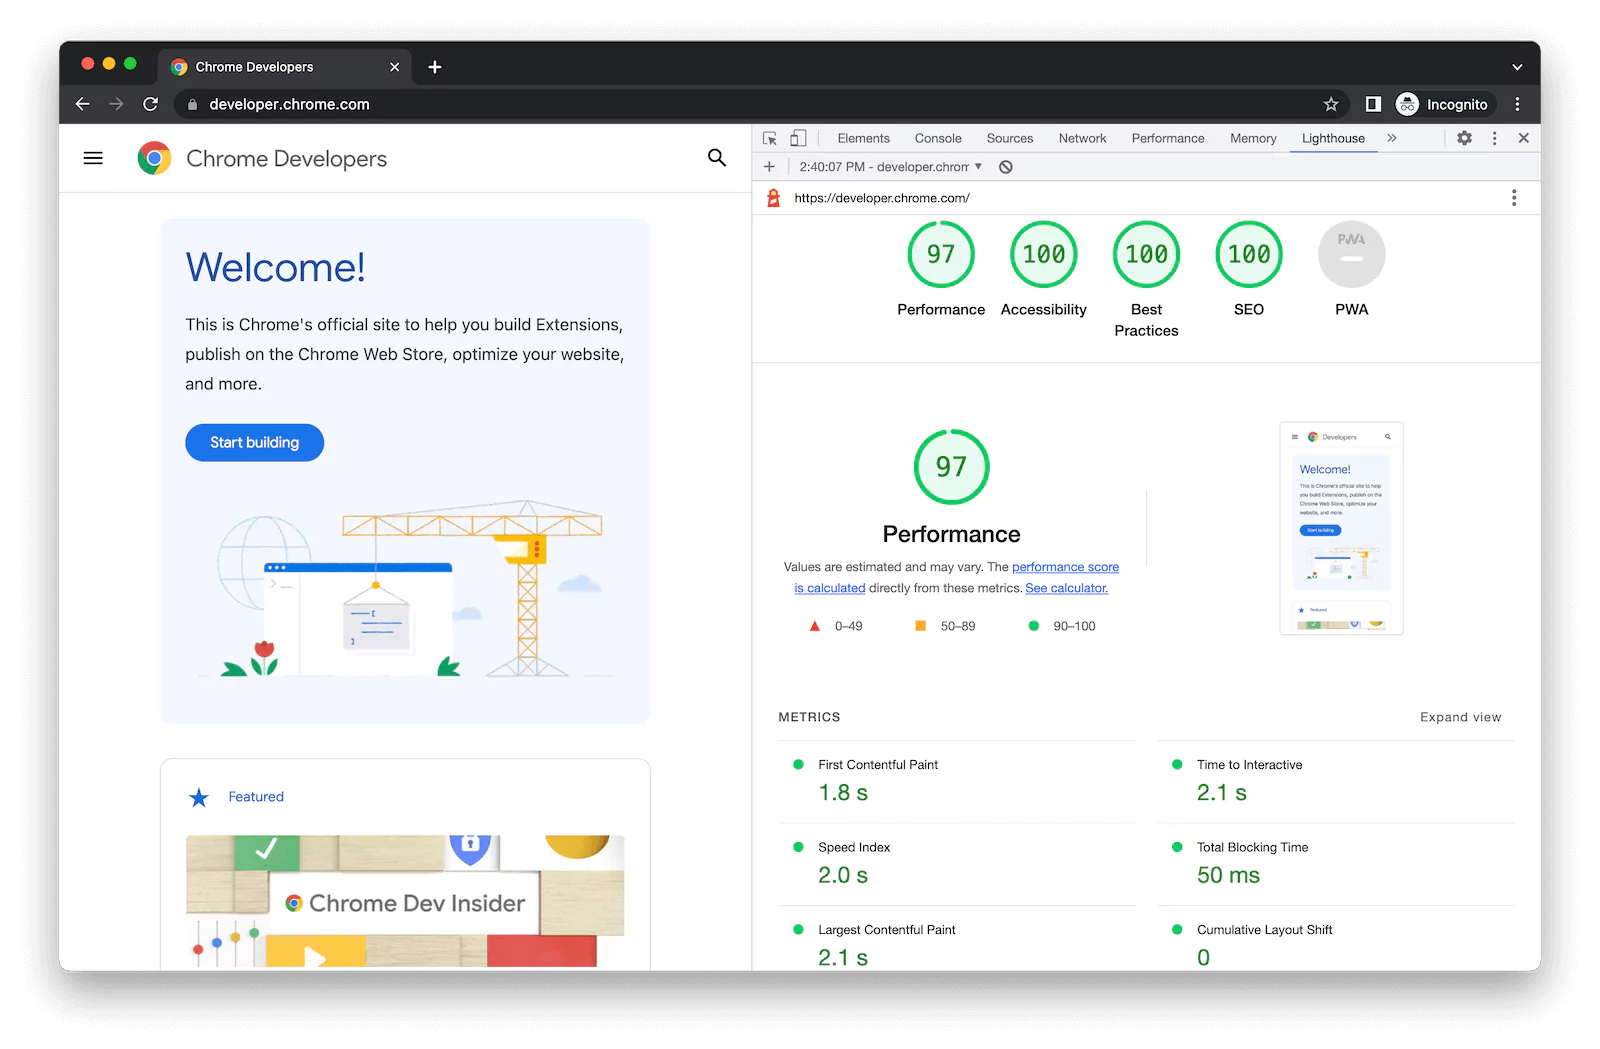
The audits offered by Lighthouse are grouped into five optimization categories: Performance, Best Practices, Accessibility, SEO and Progressive Web Apps. Users can select one, more or all five categories, depending on which aspects of their website they wish to analyze. For the first time, you can check all of them to get acquainted.
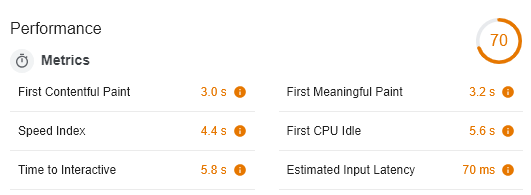
For the performance report, Lighthouse analyzes how quickly a website or app loads and how quickly users can access or view the content. Here, Lighthouse analyzes six speed metrics:
- First Contentful Paint: measures the time it takes for the first piece of content to appear on the screen. This is an important metric because it sets the user expectations for the rest of the website. If the FCP is slow, the user might become frustrated and leave the website.
- First Meaningful Paint: measures the time it takes for the most important content to appear on the screen. This metric is particularly important for websites that have a lot of content and this ensures the users can quickly access the content they need.
- Speed Index: measures how quickly the content is displayed. This is useful for determining how fast the website feels to the user. A low speed index means that the website feels fast to the user.
- Time to Interactive: measures how long it takes for the website to become interactive. This means that the user can interact with the website such as by clicking on buttons or links. This metric is critical for ensuring that the user can engage with the website without experiencing any delays.
- Estimated Input Latency: measures how long it takes for a user’s input, such as clicking on a button or filling out a form to have a response on the website. In other words, it measures how quickly the website reacts to user input. Let’s say you’re a user going to fill out a form on a website and as you start typing in a form field, you notice there is a delay between when you type and when the text that appears on the screen. This delay is input latency.
Lighthouse’s performance analysis also includes recommendations for improvements. These show many opportunities for reducing load times – such as by compressing images, by cleaning up JavaScript or CSS, or by reducing render-blocking resources, such as JavaScripts, external requests or CSS commands. Correctly implemented caching, server response times and avoiding (or limiting) redirects are also recommended ways of improving site performance.
Other performance monitoring tools you can opt for include Google PageSpeed Insights, GTmetrix, Pingdom, WebPageTest & WAVE.
How to improve application performance
Steps you can take to improve application performance:
- Run performance testing tool such as Google Lighthouse
- Apply recommendations from the reports of the tool you use
- Implement code splitting, configure webpack and use lazy loading (E.g. lazy from React). Check routing for lazy-load
- Preload secondary scripts, use keys for preloading secondary scripts and aim to not block main-thread js execution (E.g. live chat, content and GTM)
- Check static assets. Assets in the website should be lightweight, in the appropriate format (Preferred WebP). Add compression.
How to maintain high performance for projects
Steps you can take to keep performance of your projects high:
- HTTP requests: Minimize the amount of HTTP requests and combine them when possible
- Code splitting: All conditional rendering should be lazy loaded (E.g. routing, conditional component renders and etc)
- Third-party libraries: Minimize usage of third-party libraries or remove them entirely where possible
- Reload secondary scripts: Use keys for preloading secondary scripts, and prevent blocking main-thread js execution (E.g. live chat, Google Analytics)
- Static assets: Optimize assets before uploading them (size, weight, format). Use compressing websites like TinyPNG.
Conclusion About Increasing Application Performance Throug Client-Side Applications
In conclusion, optimizing client-side application performance is critical for providing a positive user experience, improving engagement, and increasing conversion rates. By following the techniques and steps outlined in this talk, we can ensure that our applications are fast, efficient, and optimized for success.
Also, contact us if you need enterprise application integration or mobile app development services.
This blog post has been created from a session presented to our team at Sphere Partners. You can watch our Software Engineer, Gevorg Zoroghlyan, present this and answer a question from our team on the video at the top!
Need help applying the recommendations in this article to improve your application performance? Reach out to us to request a consultation and our team would be happy to help.


